Simulation: True Structure
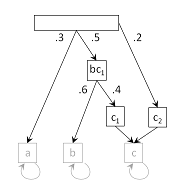
Fig. 1. The true structure of sim7 dataset. The top block is the root and its outgoing arrows correspond to initial probabilities. Bottom nodes are compartment states, named as a, b, and c. The blocks are states and the arrows are transitions, with transition probabilities labeled. The items listed inside a blocks are features emitted by the states, feature names prefixed by the compartments it is associated with. Emission probabilities are all 1 in this model.
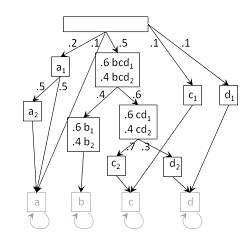
Fig. 2. The true structure of sim14 dataset. See Fig. 1 for explanation; emission probabilities are given on the left of each feature.
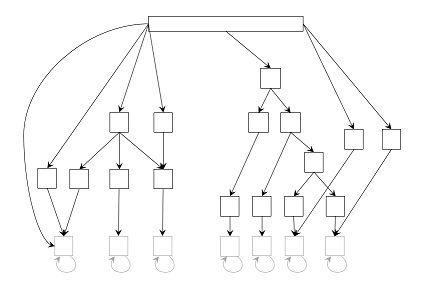
Fig. 3. The true structure of sim23 dataset. See Fig. 1 for explanation except that transition and emission probabilities are omitted. Each state has two features whose emission probabilities are 0.7 and 0.3.
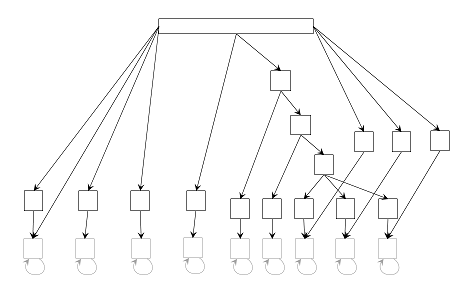
Fig. 4. The true structure of sim25 dataset. See Fig. 1 for explanation except that transition and emission probabilities are omitted. Each state has three features whose emission probabilities are 0.5, 0.3 and 0.2.
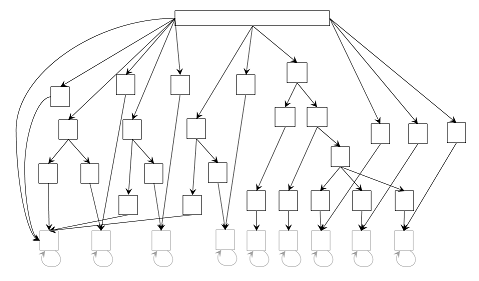
Fig. 5. The true structure of sim31 dataset. See Fig. 1 for explanation except that transition and emission probabilities are omitted. Each state has three features whose emission probabilities are 0.5, 0.3 and 0.2.
Simulation: Results
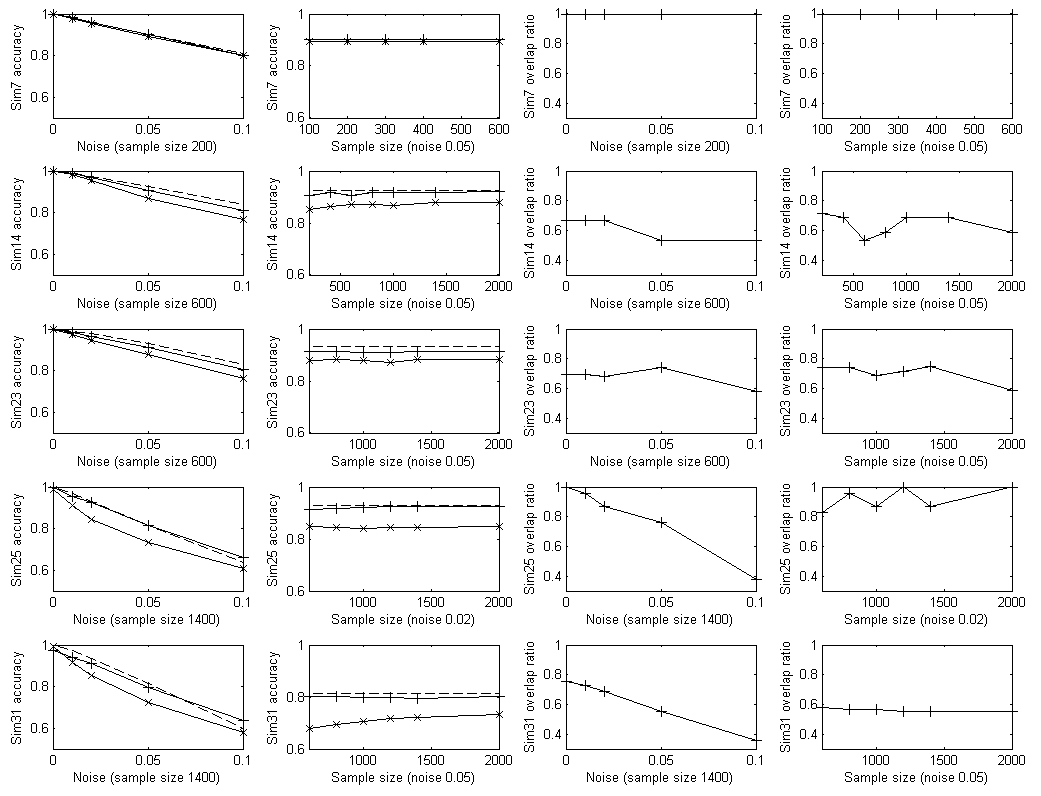
Fig. 6. Testing accuracy and overlap ratio of 5 simulated datasets described above. Each row corresponds to a dataset. The first column contains testing accuracy of varying level of noise (false positive and false negative in feature observations). The training sample sizes are fixed and indicated for each dataset. The second column contains testing accuracy of varying training sample size. The noise level is fixed and indicated for each dataset. The third and fourth column contains the ratio of overlapping nodes and edges between the learned model and the true model. The noise level is varied in the third column as the first column. The training sample size is varied in the fourth column as the second column.